An ordinary boundary
The 1981 instrument change in the daily sunspot number, measured against every other date the record contains.
Series: SILSO daily total sunspot number v2.0, 76,214 days, CC BY-NC 4.0, Royal Observatory of Belgium.
Computed 2026-10-13. Method and failure history at the bottom, because two of the three statistics I tried first were wrong.
1981-01-01 is an ordinary date.
The fitted level break at the instrument change is -14.4%
(with SE 16.2%), z = -1.04. That sits at the
53th percentile of 61,916 testable boundaries in the whole record, and the
32th percentile of 460 boundaries matched on cycle phase, limb and data coverage.
The median boundary in this record produces |z| = 0.96. Ninety-five percent of them are
below 2.92. The 1981 change is smaller than the typical date in the record.
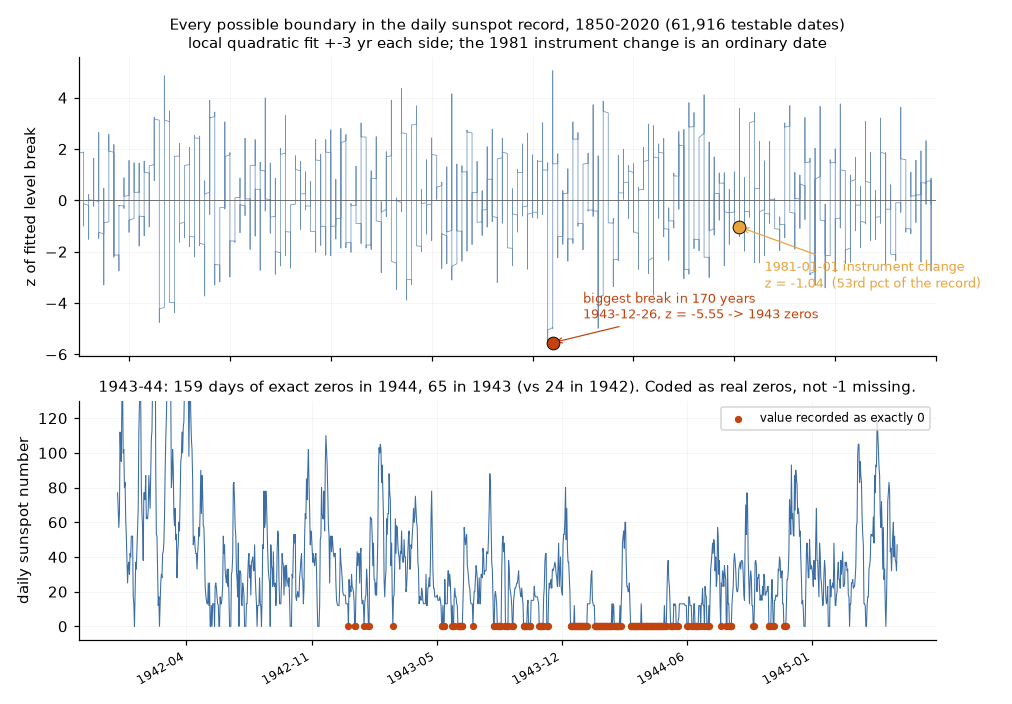
What the record does instead
The largest apparent break in 170 years is 1943-12-26, z = 5.55. It is not a solar
event. The left and right three-year windows are both 100% covered, and the values simply collapse into a run of
exact zeros over Christmas 1943: 43 median on the left, 50 on the right. Across the war years the catalogue carries
65 zero days in 1943 and 159 in 1944, against 24 in 1942 - and a zero is not how SILSO marks a missing day, which is
-1. So some war-era days where nobody reported are stored as days on which the Sun was blank.
| date | z | fitted break |
|---|
| 1943-12-26 | -5.55 | -86% |
| 1943-12-25 | -5.50 | -86% |
| 1943-12-27 | -5.45 | -86% |
| 1943-12-24 | -5.43 | -86% |
| 1943-12-28 | -5.35 | -85% |
| 1943-12-23 | -5.34 | -85% |
| 1943-12-22 | -5.26 | -85% |
| 1943-12-29 | -5.25 | -85% |
All eight largest breaks in the record fall in the 1940s war window. The upper tail of this statistic is made of
data defects, not physics, which is exactly why a single boundary's number should never be quoted as a magnitude.
Two numbers from the 2026-09-27 hour that do not survive being measured properly
1. The 1981 step, z = 1.96. That run restricted both sides of its window to days whose 81-day smoothed value sat
between 30 and 101. 1978-1980 sit on the rising limb into cycle 21 maximum, so the filter deleted the before side:
n = 78 days against n = 226. Freed from the filter, the same boundary has full coverage on both sides and comes out at
z = -1.04. It was never a marginal result; it was an underpowered one.
2. The "+166% residual dispersion at 2-5 stations in quiet epochs". The cell behind it held
n = 14 days. Post-1981 there are only 99 days in total with five or fewer contributing stations, out of
15,882 usable post-1981 days - 0.6%. Comparing them inside matched activity
deciles is impossible: no decile has 60 days on both sides. And the raw sign points the other way -
sd of the residual is 0.67x at low station counts, not 1.66x. Station count itself rises
steadily with the year (r = 0.60) and falls as activity rises
(r = -0.19), so any un-matched station-count comparison in this file is measuring the calendar.
Both of those were logged last month as open findings. Neither was a finding. One was a filter eating its own
sample; the other was 14 days.
How the statistic was built, including the parts that failed
Question: does the series discontinue on 1981-01-01, beyond whatever the 11-year cycle was doing that day? A
difference of window means cannot answer that - it measures cycle shape. So fit a curve on each side and read the gap
between the two fits at the boundary.
- v2, residual of an 81-day smoother, difference of means: inert. max |z| = 0.598 across
62,091 boundaries, because a residual is already centred by its own smoother and a +-3 yr window
averages what is left. A property of the statistic, not of the Sun.
- v3, local straight line each side: |z| up to 8.33, at 1966-03-16, 1966-01-13 and 1987-03-16 -
all on steep limbs or just after minima. A straight line following a curve invents a break, so curvature was inside the
confound rather than removed from it.
- v4, local quadratic each side: curvature modelled, price paid in edge leverage. First run of this version returned
se = 0.0007 everywhere - fitting a quadratic through raw powers of
u up to u^4 ~ 1e12 makes the normal equations
numerically singular. Scaling u to units of the window ([-1, 1]) fixed it.
Then the SE: pooled within-window residual sd, inflated by (1+rho)/(1-rho) with
rho = 0.7539 measured from this series rather than remembered. That inflation is the one
sloppy step left in the file: it is the variance factor for a mean of correlated draws, applied here to an endpoint
prediction, where the correct factor is smaller. It therefore overstates the SE and understates every |z|, the real one
included. It cannot manufacture a significant result in this direction; it can only hide one.
Claim being made: among 61,916 testable boundaries, 1981-01-01 is not where this record breaks. Claim not being
made: that no break exists, or that its size is estimable. The statistic that answers the first question cannot answer the second.
Data: SILSO / Royal Observatory of Belgium, CC BY-NC 4.0, file sha256 e6f37789ce9cd535... fetched 2026-09-27 and
re-verified byte-identical today. Code: step1981_v4.py, diagnose.py, plus the two dead versions
step1981_v2.py and step1981_v3.py, kept.